


This post will answer questions like What is multicollinearity ?, What are the problems that arise out of Multicollinearity? When do I have to fix Multicollinearity?
and How to fix Multicollinearity?
One of the important aspect that we have to take care of while regression is Multicollinearity. Check this post to find an explanation of Multiple Linear Regression and dependent/independent variables.
Just a refresher,
- Dependent variable is the one that we want to predict.
- Independent variable is the one that is used to predict the dependent variable.
- Our goal in regression is to find out which of the independent variables can be used to predict dependent variable.
What is Multicollinearity?
Lets see what Multicollinearity is and why we should be worried about it.
One of the conditions for a variable to be an Independent variable is that it has to be independent of other variables. i.e We shouldn’t be able to derive the values of this variable using other independent variables.
As we have seen in the previous articles, The equation of dependent variable with respect to independent variables can be written as

Let’s take an example of Loan Data.
if X1 = Total Loan Amount, X2 = Principal Amount, X3 = Interest Amount.
We can find out the value of X1 by (X2 + X3). This indicates that there is strong multicollinearity among X1, X2 and X3.
Our Independent Variable (X1) is not exactly independent.
Indeed There is!. If you look at the equation, you can see X1 is accompanied with m1 which is the coefficient of X1.
For Linear Regression, coefficient (m1) represents the mean change in the dependent variable (y) for each 1 unit change in an independent variable (X1) when you hold all of the other independent variables constant.
For example, in the previous article , we saw the equation for predicted medical expense to be
predicted_expense = (age x 255.3)
+ (bmi x 318.62)
+ (children x 509.21)
+ (smoker x 23240)
– (region_southeast x 777.08)
– (region_southwest x 765.40)
In case of smoker, the coefficient is 23,240. Which means predicted expense will increase by 23240 if the person is a smoker , and reduces by 23,240 if the person is a non-smoker (provided all other variables are constant).
What are the problems that arise out of multicollinearity?
In our Loan example, we saw that X1 is the sum of X2 and X3. Because of this relationship, we cannot expect the values of X2 or X3 to be constant when there is a change in X1.
So, in this case we cannot exactly trust the coefficient value (m1) .We don’t know the exact affect X1 has on the dependent variable.
In the article Feature Elimination Using p-values, we discussed about p-values and how we use that value to see if a feature/independent variable is statistically significant or not.
Since multicollinearity reduces the accuracy of the coefficients, We might not be able to trust the p-values to identify independent variables that are statistically significant.
When do I have to fix Multicollinearity?
However the Good News is that Multicollinearity only affects the coefficients and p-values, but it does not influence the model’s ability to predict the dependent variable.
Which means that if you only care about prediction values, you don’t really have to worry about multicollinearity. But in some business cases, we would actually have to focus on individual independent variable’s affect on the dependent variable. Then in that case we have to reduce multicollinearity in the data.
We saw what Multicollinearity is and what are the problems that it causes. Now we will see how to fix it.
How to fix Multicollinearity?
Once you have decided that multicollinearity is a problem for you and you need to fix it, you need to focus on Variance Inflation Factor (VIF). VIF values help us in identifying the correlation between independent variables.
Before you start, you have to know the range of VIF and what levels of multicollinearity does it signify.
VIF ~ 1: Negligible
1<VIF<5 : Moderate
VIF>5 : Extreme
We usually try to keep multicollinearity in moderate levels. So, we have to make sure that the independent variables have VIF values < 5.
Let’s take the loan data example.
Loan data has the following columns,
loan_amnt: Loan Amount sanctioned
total_pymnt: Total Amount Paid till now
total_rec_prncp: Total Principal Amount Paid till now
total_rec_int: Total Interest Amount Paid till now
term: Term of the loan
int_rate: Interest Rate
loan_status: Status of the loan (Paid or Charged Off)
# Load csv into DataFrame
data = pd.read_csv("loan.csv")

# Data Cleanup
data.term = data['term'].apply(lambda x:int(x.replace('months','')))
data.int_rate = data.int_rate.apply(lambda x:float(x.replace('%','')))
data = data[data['loan_status']!='Current']
data['loan_status'] = data['loan_status'].map({'Charged Off':1, 'Fully Paid':0})

# Separating independent variables into X and dependent variable into y
X = data[['loan_amnt','total_pymnt','total_rec_prncp','total_rec_int','term','int_rate']]
y = data['loan_status']
X = sm.add_constant(X)

X.head()

Just to get a peek at the correlation between variables, we use heatmap()
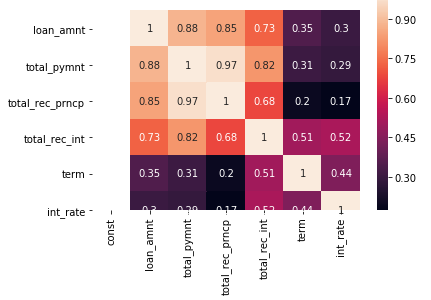
But, this wont work when the number of columns is high.
Let’s calculate VIF values for each independent column .
# Function to calculate VIF
def calculate_vif(data):
    vif_df = pd.DataFrame(columns = ['Var', 'Vif'])
    x_var_names = data.columns
    for i in range(0, x_var_names.shape[0]):
        y = data[x_var_names[i]]
        x = data[x_var_names.drop([x_var_names[i]])]
        r_squared = sm.OLS(y,x).fit().rsquared
        vif = round(1/(1-r_squared),2)
        vif_df.loc[i] = [x_var_names[i], vif]
    return vif_df.sort_values(by = 'Vif', axis = 0, ascending=False, inplace=False)
Let’s fit a Linear Regression model and check the coefficients. Also , calculate VIF values
lm = sm.OLS(y, X).fit()
print("Coeffients: \n{0}".format(lm.params))
calculate_vif(X)

Please ignore the ‘const’ column for now. And we can see really low coefficients because probably these variables have very little influence on the dependent variable. But we are not here to discuss that. Let’s focus on VIF values.
As we can see that total_pymnt , total_rec_prncp, total_rec_int have VIF>5 (Extreme multicollinearity). Which is obvious since total_pymnt = total_rec_prncp + total_rec_int
To reduce multicollinearity, let’s remove the column with the highest VIF and check the results.
# Dropping total_pymnt as VIF was highest
X.drop(['total_pymnt'], axis=1, inplace=True)
lm = sm.OLS(y, X).fit()
print("Coeffients: \n{0}".format(lm.params))
calculate_vif(X)

If you notice, the removal of ‘total_pymnt’ changed the VIF value of only the variables that it had correlations with (total_rec_prncp, total_rec_int).
The coefficients of the independent variables before and after reducing multicollinearity.
There is significant change between them.
total_rec_prncp -0.000089 -> -0.000069
total_rec_int -0.000007 -> 0.000015
So, finally we were successful in bringing multicollinearity to moderate levels and now our dependent variables have VIF < 5.
That’s it for this post!.
Here’s my GitHub for Jupyter Notebooks on Linear Regression. Please feel free to check it out and suggest more ways to reduce multicollinearity here in responses.
Thank you for reading!
Please check out my posts at Medium and follow me.

Do you mind if I quote a couple of your posts as long as I provide credit and sources back to your weblog? My blog is in the exact same area of interest as yours and my visitors would definitely benefit from a lot of the information you provide here. Please let me know if this ok with you. Many thanks!|
LikeLike
Its All good Rick, no problem at all!
LikeLike
Hello! I simply wish to give you a big thumbs up for your great information you’ve got here on this post. I am coming back to your blog for more soon.|
LikeLike
Hey there! I’ve been following your blog for a long time now and finally got the courage to go ahead and give you a shout out from Dallas Tx! Just wanted to say keep up the excellent work!|
LikeLike
kindly upload loan.cvs data set
LikeLike